Monitoring GPU usage is an essential task for anyone who wants to ensure their computer is performing optimally, whether for gaming, video editing, or any other graphics-intensive application. In Windows 10 and 11, you can easily check how your GPU is being utilized using the built-in Task Manager. I recently went through the process of monitoring GPU usage on my own system, and I’d like to share the steps I followed to keep track of my graphics performance effectively.
Firstly, I made sure my Windows 10 or 11 operating system was up-to-date to ensure I had the latest features and improvements. To do this, I went to the Settings menu, clicked on “Update & Security,” and then selected “Windows Update” to check for any pending updates. Once my system was fully updated, I proceeded with the task.
To begin monitoring GPU usage, I first opened the Task Manager. You can do this by pressing the `Ctrl + Shift + Esc` keyboard shortcut, which brings up the Task Manager directly. Alternatively, you can right-click on the taskbar and select “Task Manager” from the context menu. If you’re using Windows 11, you can also access Task Manager by right-clicking the Start button and choosing “Task Manager” from the list.
When Task Manager opened, I was initially greeted with a simplified view. To get more detailed information, I needed to switch to the “More details” view. This can be done by clicking on the “More details” button at the bottom left corner of the Task Manager window. In this detailed view, Task Manager displays additional tabs and more comprehensive data about system performance and resource usage.
Next, I navigated to the “Performance” tab. This tab is crucial for monitoring various aspects of system performance, including CPU, memory, disk, and GPU. In the “Performance” tab, there is a list of components on the left side. I selected “GPU” from this list to view detailed statistics about my graphics processing unit.
The GPU section provided a wealth of information. The main window was divided into several sections, each showing different metrics. At the top, I saw a graph that displayed the current GPU utilization percentage. This graph provides a visual representation of how much of the GPU’s processing power is being used in real-time. This is particularly useful when running applications or games that rely heavily on the GPU, as it shows how the workload is distributed.
Below the graph, there were additional metrics such as “GPU Memory,” which showed how much of the GPU’s dedicated memory (VRAM) was being used. This is important to monitor because running out of VRAM can lead to performance issues or graphical glitches in demanding applications. The “Dedicated GPU Memory” and “Shared GPU Memory” sections helped me understand how my GPU memory was being allocated and utilized.
The Task Manager also displayed other relevant data, including GPU temperature and the type of GPU in use. This information is critical for maintaining optimal performance and ensuring that the GPU is not overheating. Some GPUs have built-in temperature sensors that help monitor heat levels, which can be crucial for preventing hardware damage and maintaining overall system stability.
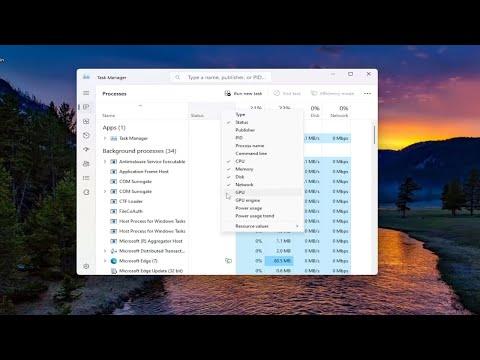
One aspect I found particularly useful was the ability to monitor GPU usage per process. By switching to the “Details” tab in Task Manager, I could see a list of all running processes and their individual GPU usage. This allowed me to identify any applications or background processes that were consuming an unusually high amount of GPU resources. By right-clicking on a specific process and selecting “Go to details,” I could further investigate which process was using the GPU and take appropriate actions if needed, such as closing or adjusting the settings of resource-intensive applications.
For those interested in a more comprehensive analysis of GPU performance, Task Manager also provides options for exporting performance data. By right-clicking on the GPU graph or using the “Export” button (if available), you can save performance data for further analysis. This can be useful for tracking performance over time or for troubleshooting persistent issues.
In addition to using Task Manager, I also considered other tools and methods for monitoring GPU performance. While Task Manager is convenient and integrated into Windows, there are third-party applications like GPU-Z, MSI Afterburner, or HWMonitor that offer more in-depth analysis and additional features. These tools can provide detailed insights into GPU temperature, power consumption, and clock speeds, which can be useful for enthusiasts or those performing advanced troubleshooting.
Overall, Task Manager in Windows 10 and 11 offers a straightforward and accessible way to monitor GPU usage. By following the steps I described, I was able to keep an eye on how my GPU was performing, identify any potential issues, and ensure that my system was running smoothly. Whether you’re a gamer, a content creator, or just a regular user, keeping track of GPU performance is an important aspect of maintaining a well-functioning computer.